Golden Gate Ferry Research Library
Ferry History - from start-up in 1970 to today
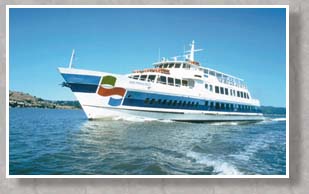
The Fleet - Golden Gate Ferry currently has a fleet of 7 vessels
Statistics & Ridership
Photo Library
Golden Gate Ferry operates daily service on three separate routes, with the exception of New Year's, Thanksgiving, and Christmas days when there is no service.
All Golden Gate Ferry vessels feature multiple decks, indoor and outdoor seating, full-service refreshment stands and space for 15 to 200 bicycles, depending on vessel.
In San Francisco, Golden Gate Ferry boats depart to Sausalito, Larkspur, or Tiburon from the Golden Gate San Francisco Ferry Terminal located behind the historic San Francisco Ferry Building along the Embarcadero at the foot of Market Street.
Golden Gate Sausalito Ferry route is served by a 715-passenger Spaulding class vessel which makes daily crossings. The 30-minute trip (one way) offers dramatic views of the Golden Gate Bridge, Alcatraz, Angel Island, and the San Francisco skyline. The Bridge at sunset is especially spectacular! The ferry docks in the heart of downtown Sausalito at Humboldt and Anchor. This quaint hill town, settled in the 1860's, offers unusual shops and great restaurants.
Golden Gate Larkspur Ferry operates service between Larkspur and San Francisco on weekdays, by three high-speed catamarans, and on weekends by a high-speed catamaran or 715-passenger Spaulding class vessel. The one-way trip takes 30 to 50 minutes depending on the vessel. This route offers spectacular views of the Golden Gate Bridge, Angel Island, Marin hill towns, and magnificent Mount Tamalpais. Larkspur Ferry docks at a terminal in central Marin County, just across the street from the Larkspur Landing Shopping Center (once the site of a quarry near San Quentin Prison). The Landing offers an array of unique shops, outdoor areas and restaurants.
Golden Gate Tiburon Ferry operates service between Tiburon and San Francisco on weekdays only. The one-way trip takes 30 minutes and offers spectacular views of the Golden Gate Bridge, Angel Island, and magnificent Mount Tamalpais. The Tiburon Ferry Landing is located in downtown Tiburon, adjacent to popular restaurants and boutique shops.